Visualize and analyze your closed loan data with month over month statistics and dashboards. Use insightful business dashboards to track your key closed loan performance indicators (KPIs), and share them with your colleagues for easier data analysis and collaboration.
" Now I have an easy way to track,
manage and take action
where needed like never before . . . "
Brian D.
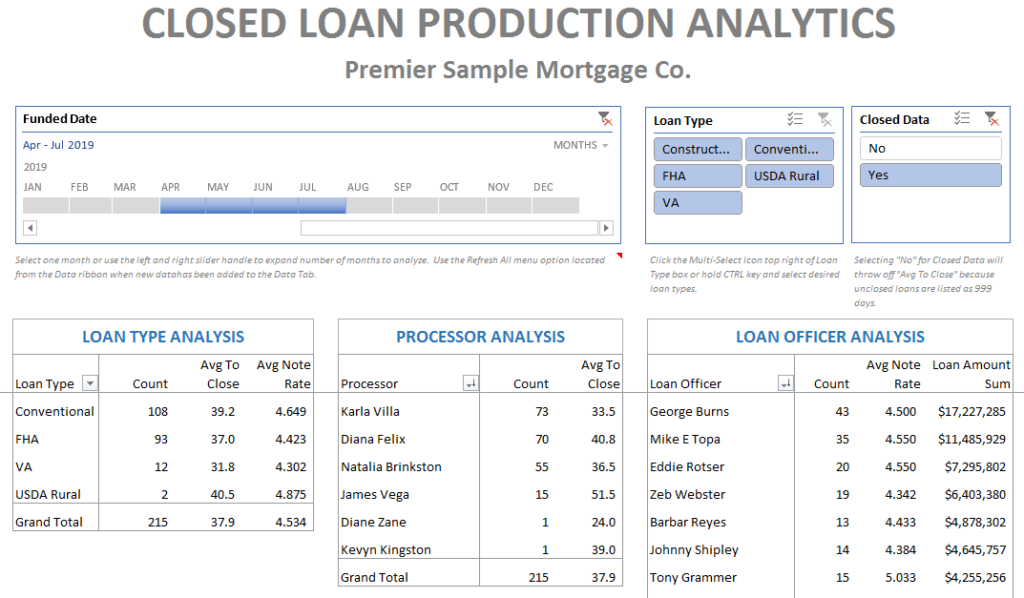
Use Your Own Data
Use data you already have from your favorite Loan Origination System to see instant closed loan statistics from your production team. Works with data from all LOS systems that can export in CSV or Excel format.
Loan types are dynamic based on your loan programs. Loan Officer, processor and underwriter names are based on the roles identified from your import data.
Deeper Analytics
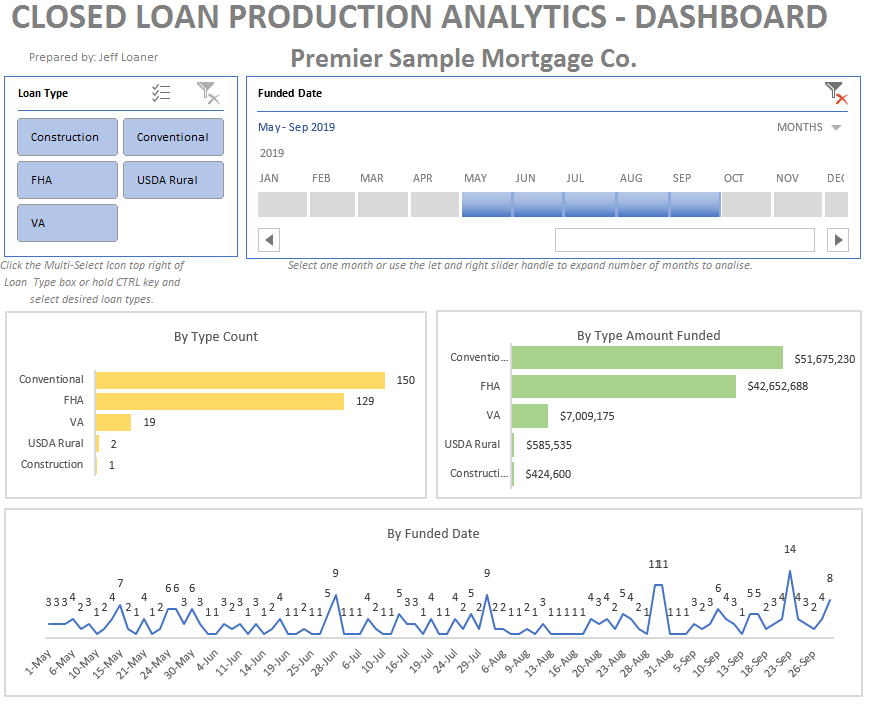
There are options to select one or more loan types along with a date range slider. Click to select one month or months to display. A quick drop down list makes it easy to select the date period to display, months, quarters or years.
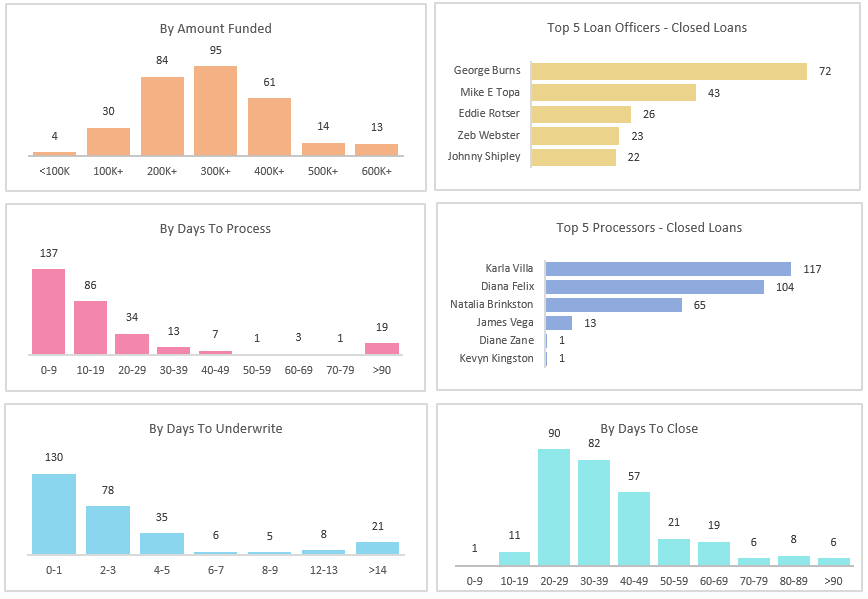
Track Key Metrics
With insightful business dashboards using selectable date ranges, months, quarters or years.
For more information or to see a demo click the button below Today!